A dive into Einstein Analytics...


Hi Everyone 👋 ,
Firstly, thank you so much for taking out the time to land here and giving your time to go through my blog. Hope you have a good and informative read!!
So to start with, the topic for my blog is Tableau CRM or formerly known as Einstein Analytics, a native Salesforce BI and data discovery tool.
To put simply Tableau CRM (Einstein Analytics) is an app used to visualize the activity occurring in your Salesforce environment with the help of dashboards, widgets and lenses. I know the terms might be alien, but don't worry, with the progression of the series of the blog I will try to bring in all the information for you guys!
What is Salesforce??
Salesforce is a Customer Relationship Management (CRM) solution that helps bringing customers and companies together. The platform includes solutions and products on marketing, sales, service and commerce. In the recent years Salesforce has grown and came out as the #1 CRM solution and has evolved into the market rapidly with increasing it's arena not only in sales and service but also in health and financial services.
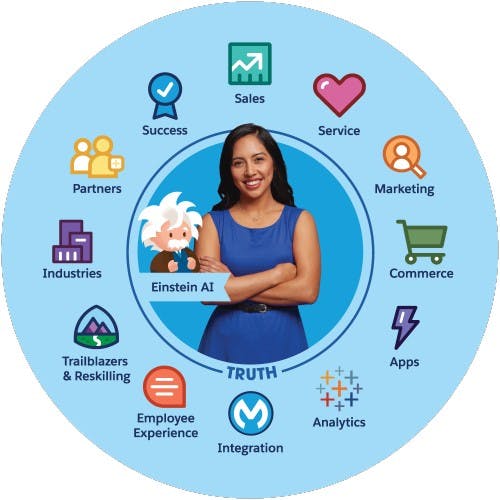
The platform offers numerous products and has a wide range of offerings for the companies who wish to avail the benefits of this great solution. For more check out the link on the above image!
What is Einstein Analytics (EA)??
Einstein Analytics is the advanced analytics solution that uses the power of advanced AI(artificial intelligence). The solution empowers it's users to visualize the data directly into the environment using AI and insights. Complex sales pipeline dashboards and weather forecast insights, all can be achieved using EA.
EA is generally a paid feature for the production orgs and the licenses are priced differently as per the user need and customer requirement. For more information on license pricing and procurement for your business please click on the image below and explore it all.
Learning Road Map for Einstein Analytics
In the blog series, I would try to create a road map with little blogs in the coming, to give you all proper demo examples and steps to start your own learning journey with this amazing Analytics tool. We will start with creating a dev org with Tableau CRM (formerly Einstein Analytics) enabled and then get on the journey of building a dashboard step by step. So let's get into the shuttle and start the countdown for blastoff into this amazing tool..

Creating a Einstein Analytics enabled Dev Org:
- Click here .
- Fill out the form. For Email, enter an active email address. For Username, enter a username that looks like an email address and is unique, but it doesn’t need to be a valid email account. For example, your username can be yourname@tableaurocks.de, or you can put in your company name.
- After you fill out the form, click Sign me up. A confirmation message appears, asking you to check your email.
- When you receive the activation email, open it and click Verify Account.
- Complete your registration by setting your password and challenge question.
Now we're ready with our environment to start and explore Einstein Analytics and see what all features it has instore for us.
Using the login username and password set up by us, we will now log in into our dev environment and have the first glance at the app 'Analytics Studio' which is the home for Tableau CRM in our orgs. All of the dashboard creation and designing is done in that app.
Got to login.salesforce.com and enter your org credentials.
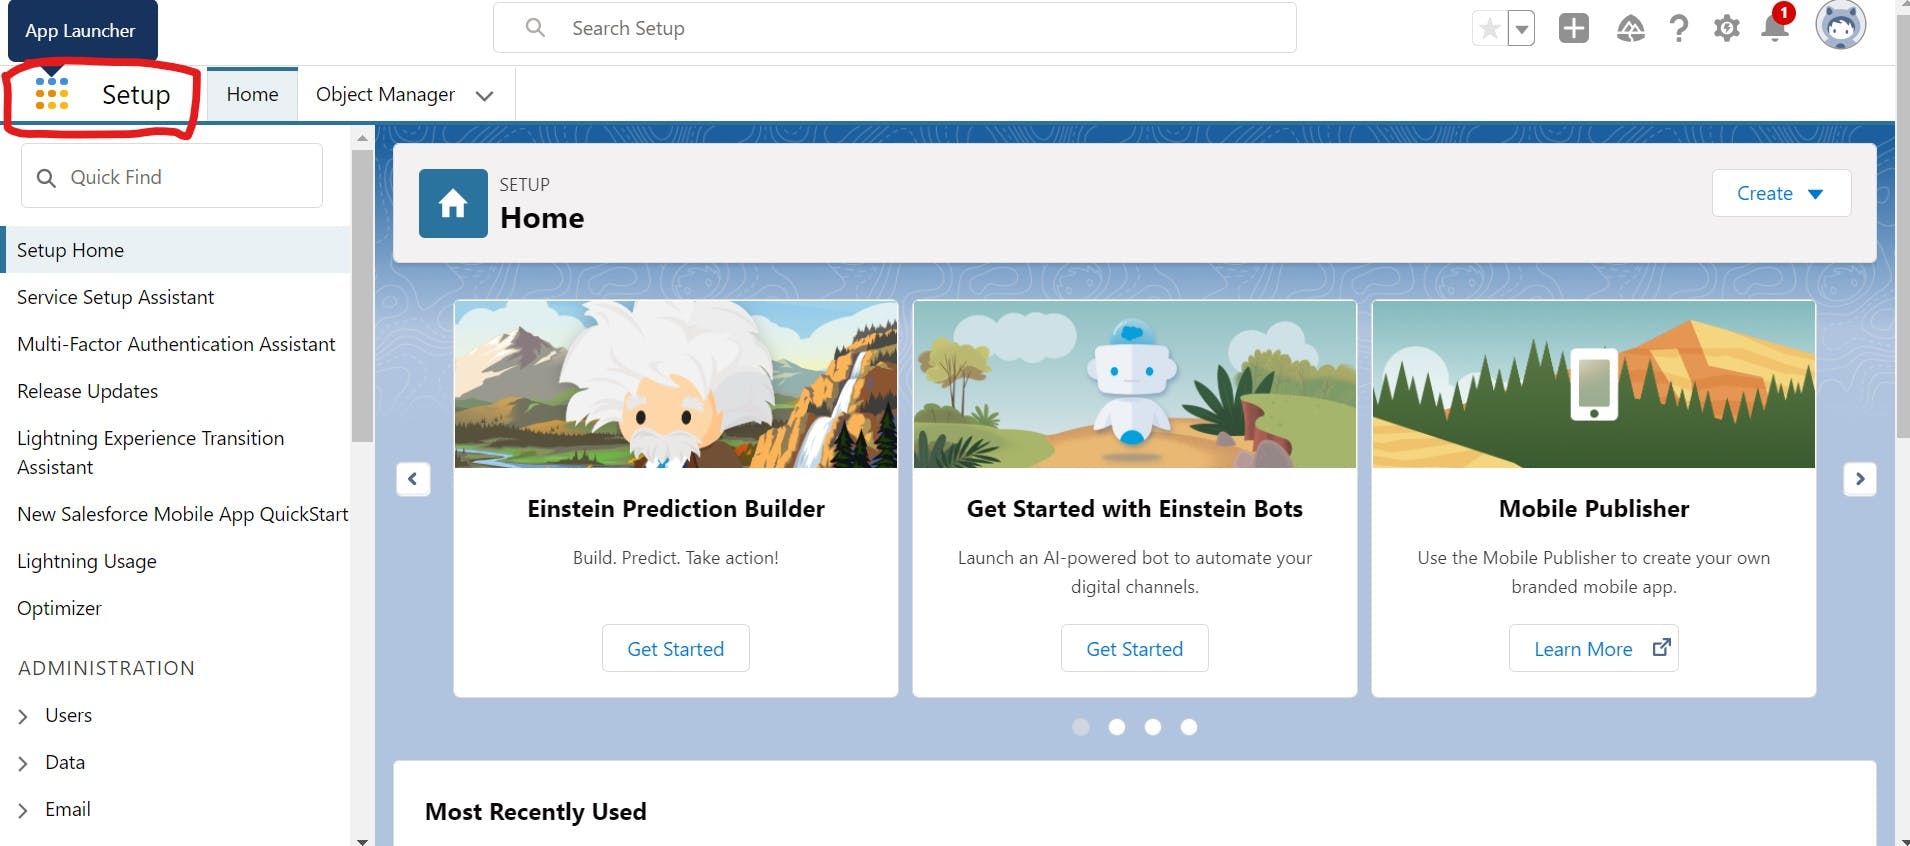
In the top left click on the waffle icon and search for 'Analytics Studio'.
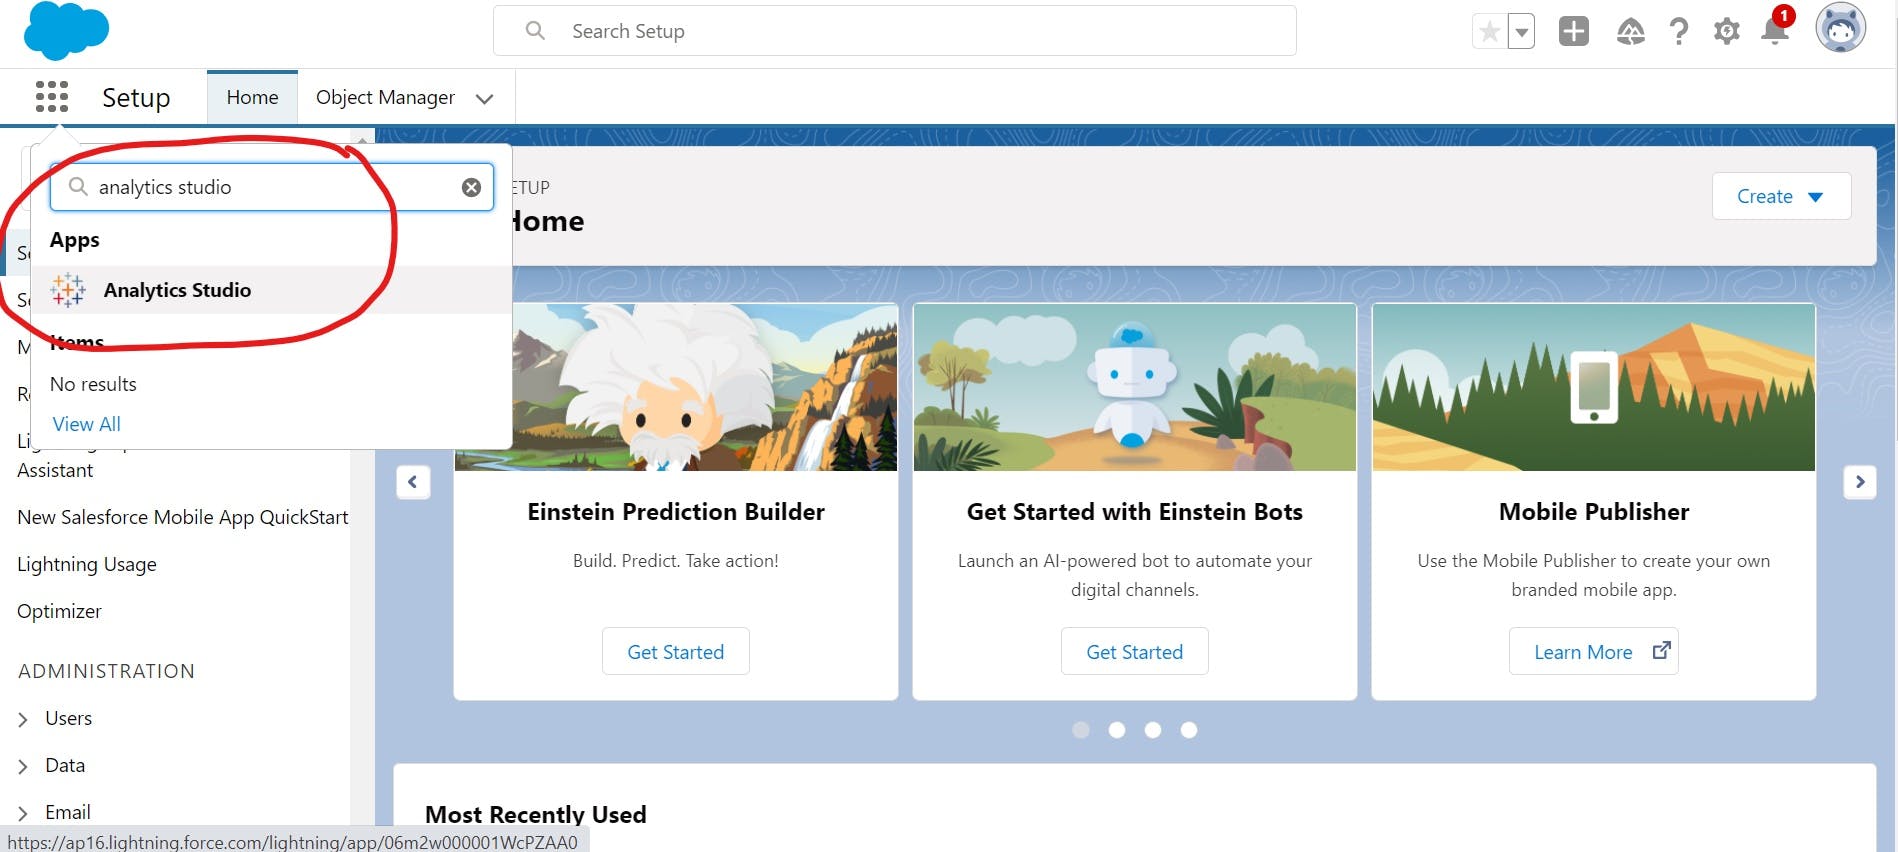
- Click on the name and observe a new window opening. That is the Tableau CRM instance for us to develop and build our dashboards and insights.
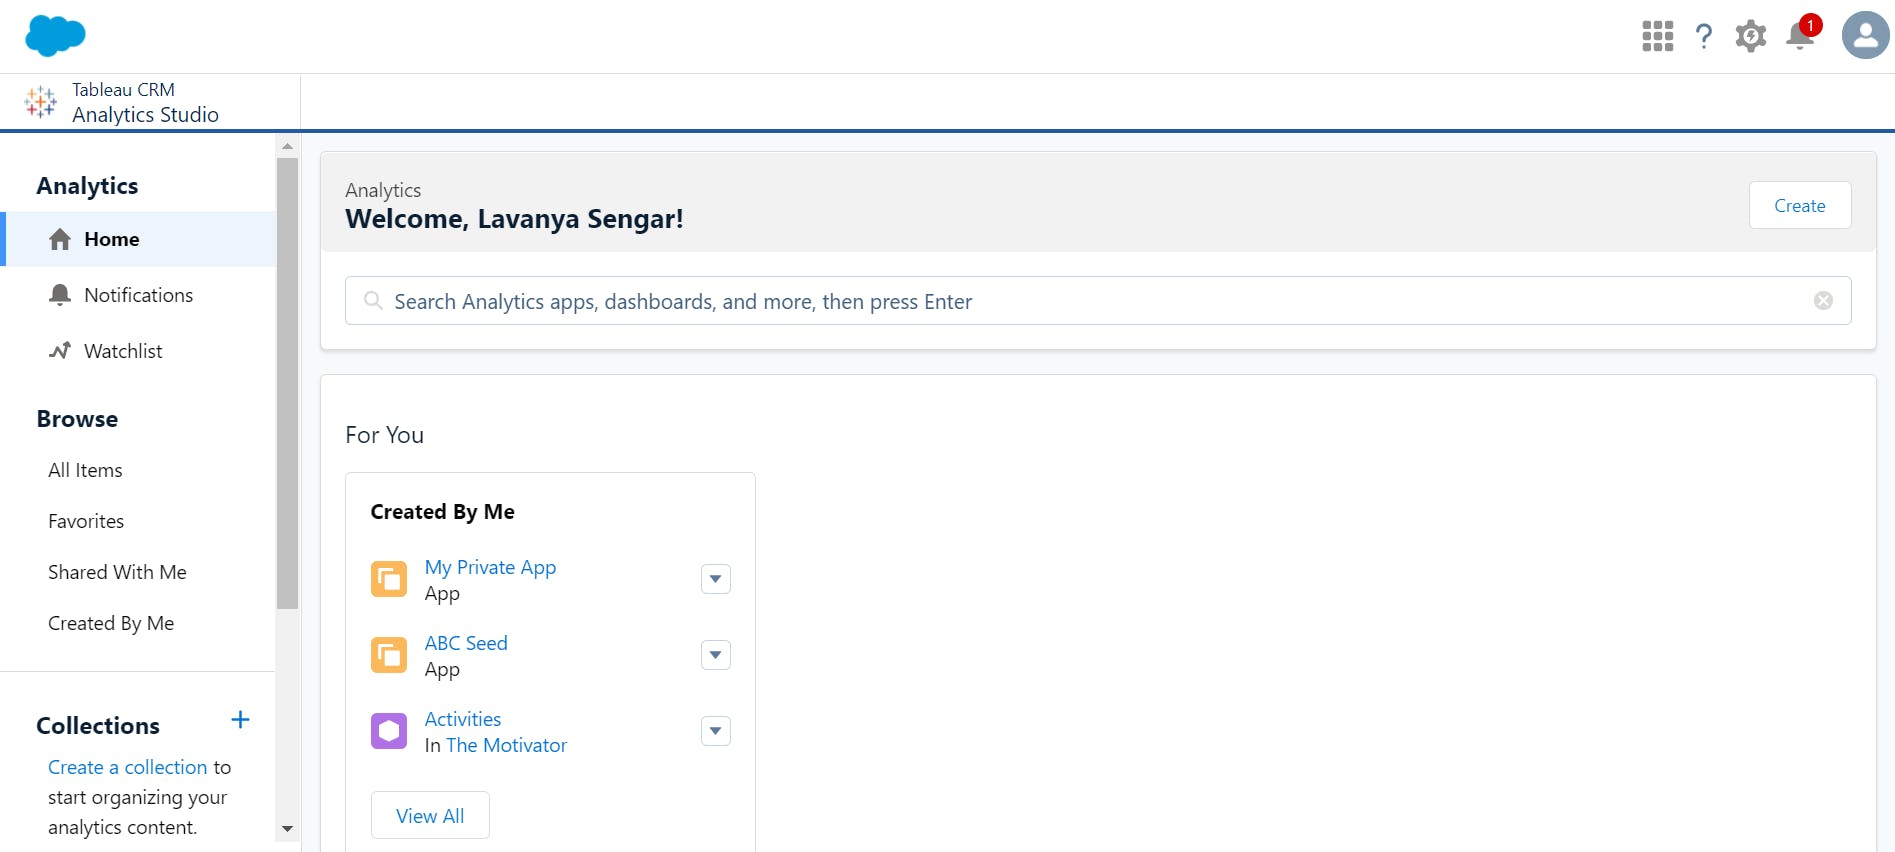
On this environment we can start with our dataset designing, development and building our full fledged analytics insights and AI powered dashboards that give a whole new dynamic view of the data that was once just on reports and simple pie charts.
In my next blog, I will start with design basics for dashboards and we will look into how to get our data into our analytics studio and how to model it into dataflows and recipes which evolve into high functioning dashboards.
So stay tuned and thank you so much for reading..!!